
The True Cost of Returns: 2026 Data & Reduction Guide
The True Cost of Returns: 2026 Data & Reduction Guide
The True Cost of Returns: 2026 Data & Reduction Guide

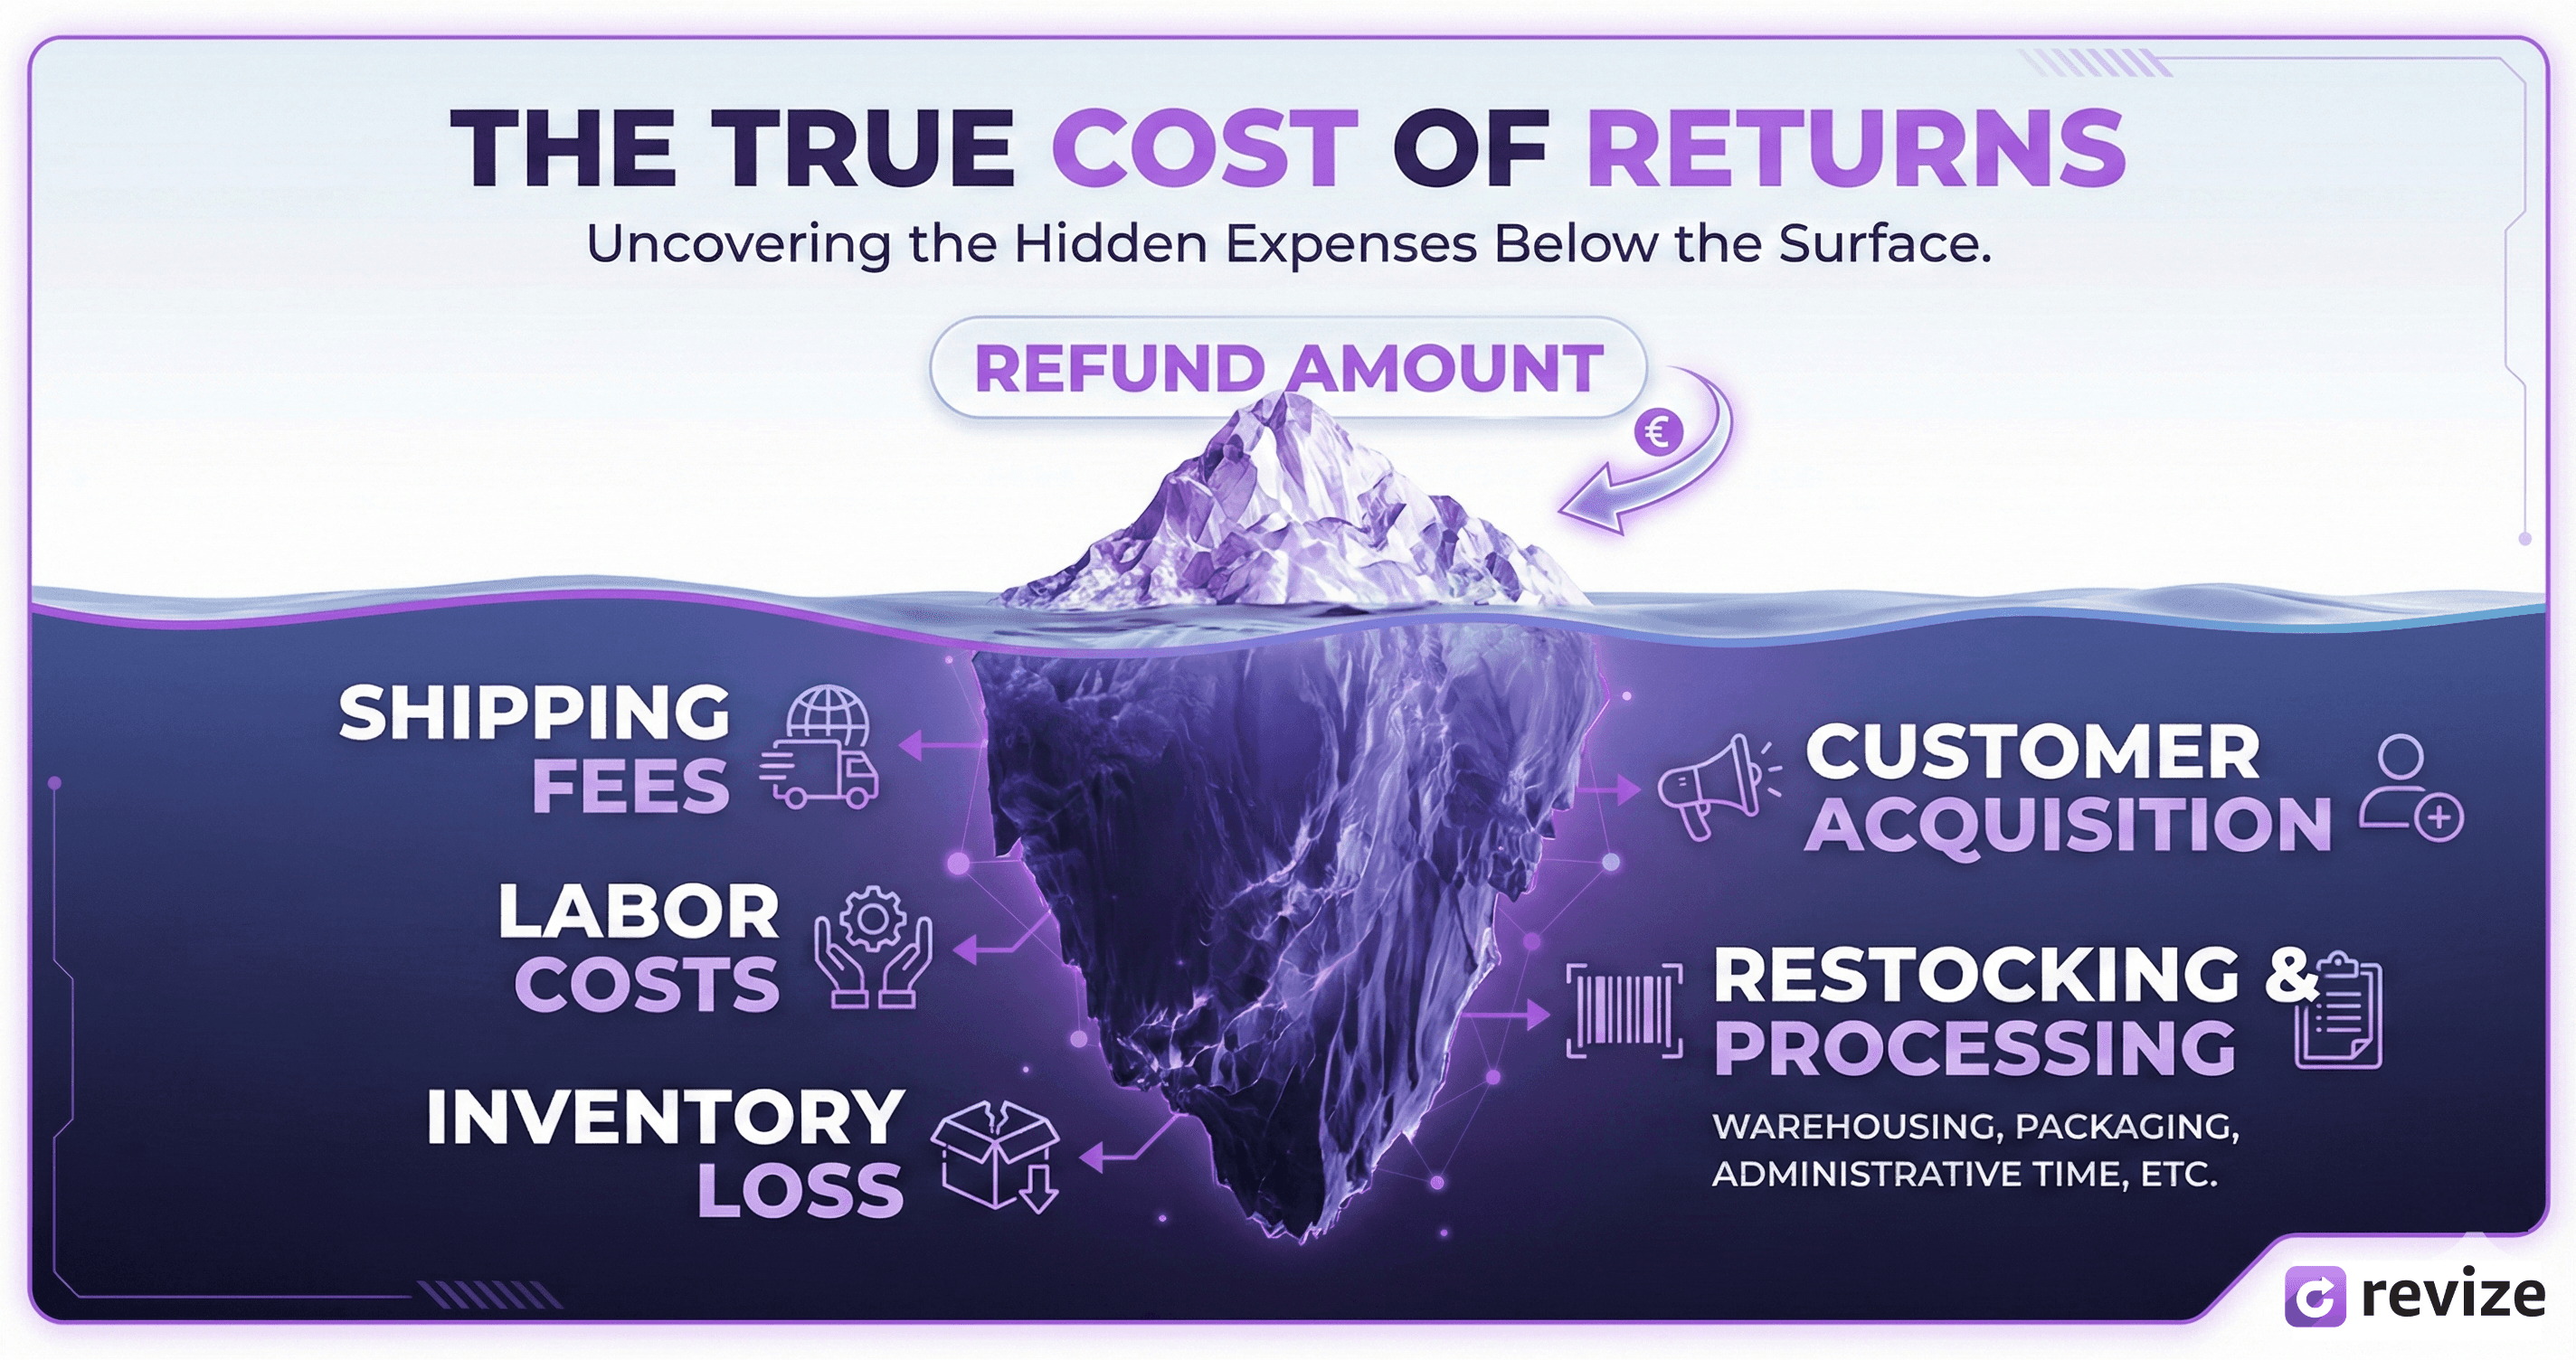
Returns are the tax nobody budgets for.
You know the number on your returns report. The refund amount. Maybe the restocking fees you charge (or don't). But that number is lying to you.
The actual cost of a return is 3-4x what most merchants think. And at scale—especially for Shopify Plus stores doing thousands of orders monthly—that gap between perceived cost and real cost is the difference between healthy margins and wondering where all the profit went.
This guide breaks down exactly what returns actually cost, where the hidden fees live, and what the most profitable stores do differently.
The Numbers: What Returns Actually Cost in 2026
Let's start with the macro picture, then zoom into what this means for your store.
Industry-Wide Return Costs
The National Retail Federation estimates that $743 billion worth of merchandise was returned in 2024. For online retail specifically, return rates hover between 20-30%, compared to 8-10% for brick-and-mortar.
But the return rate isn't the scary number. The cost per return is.
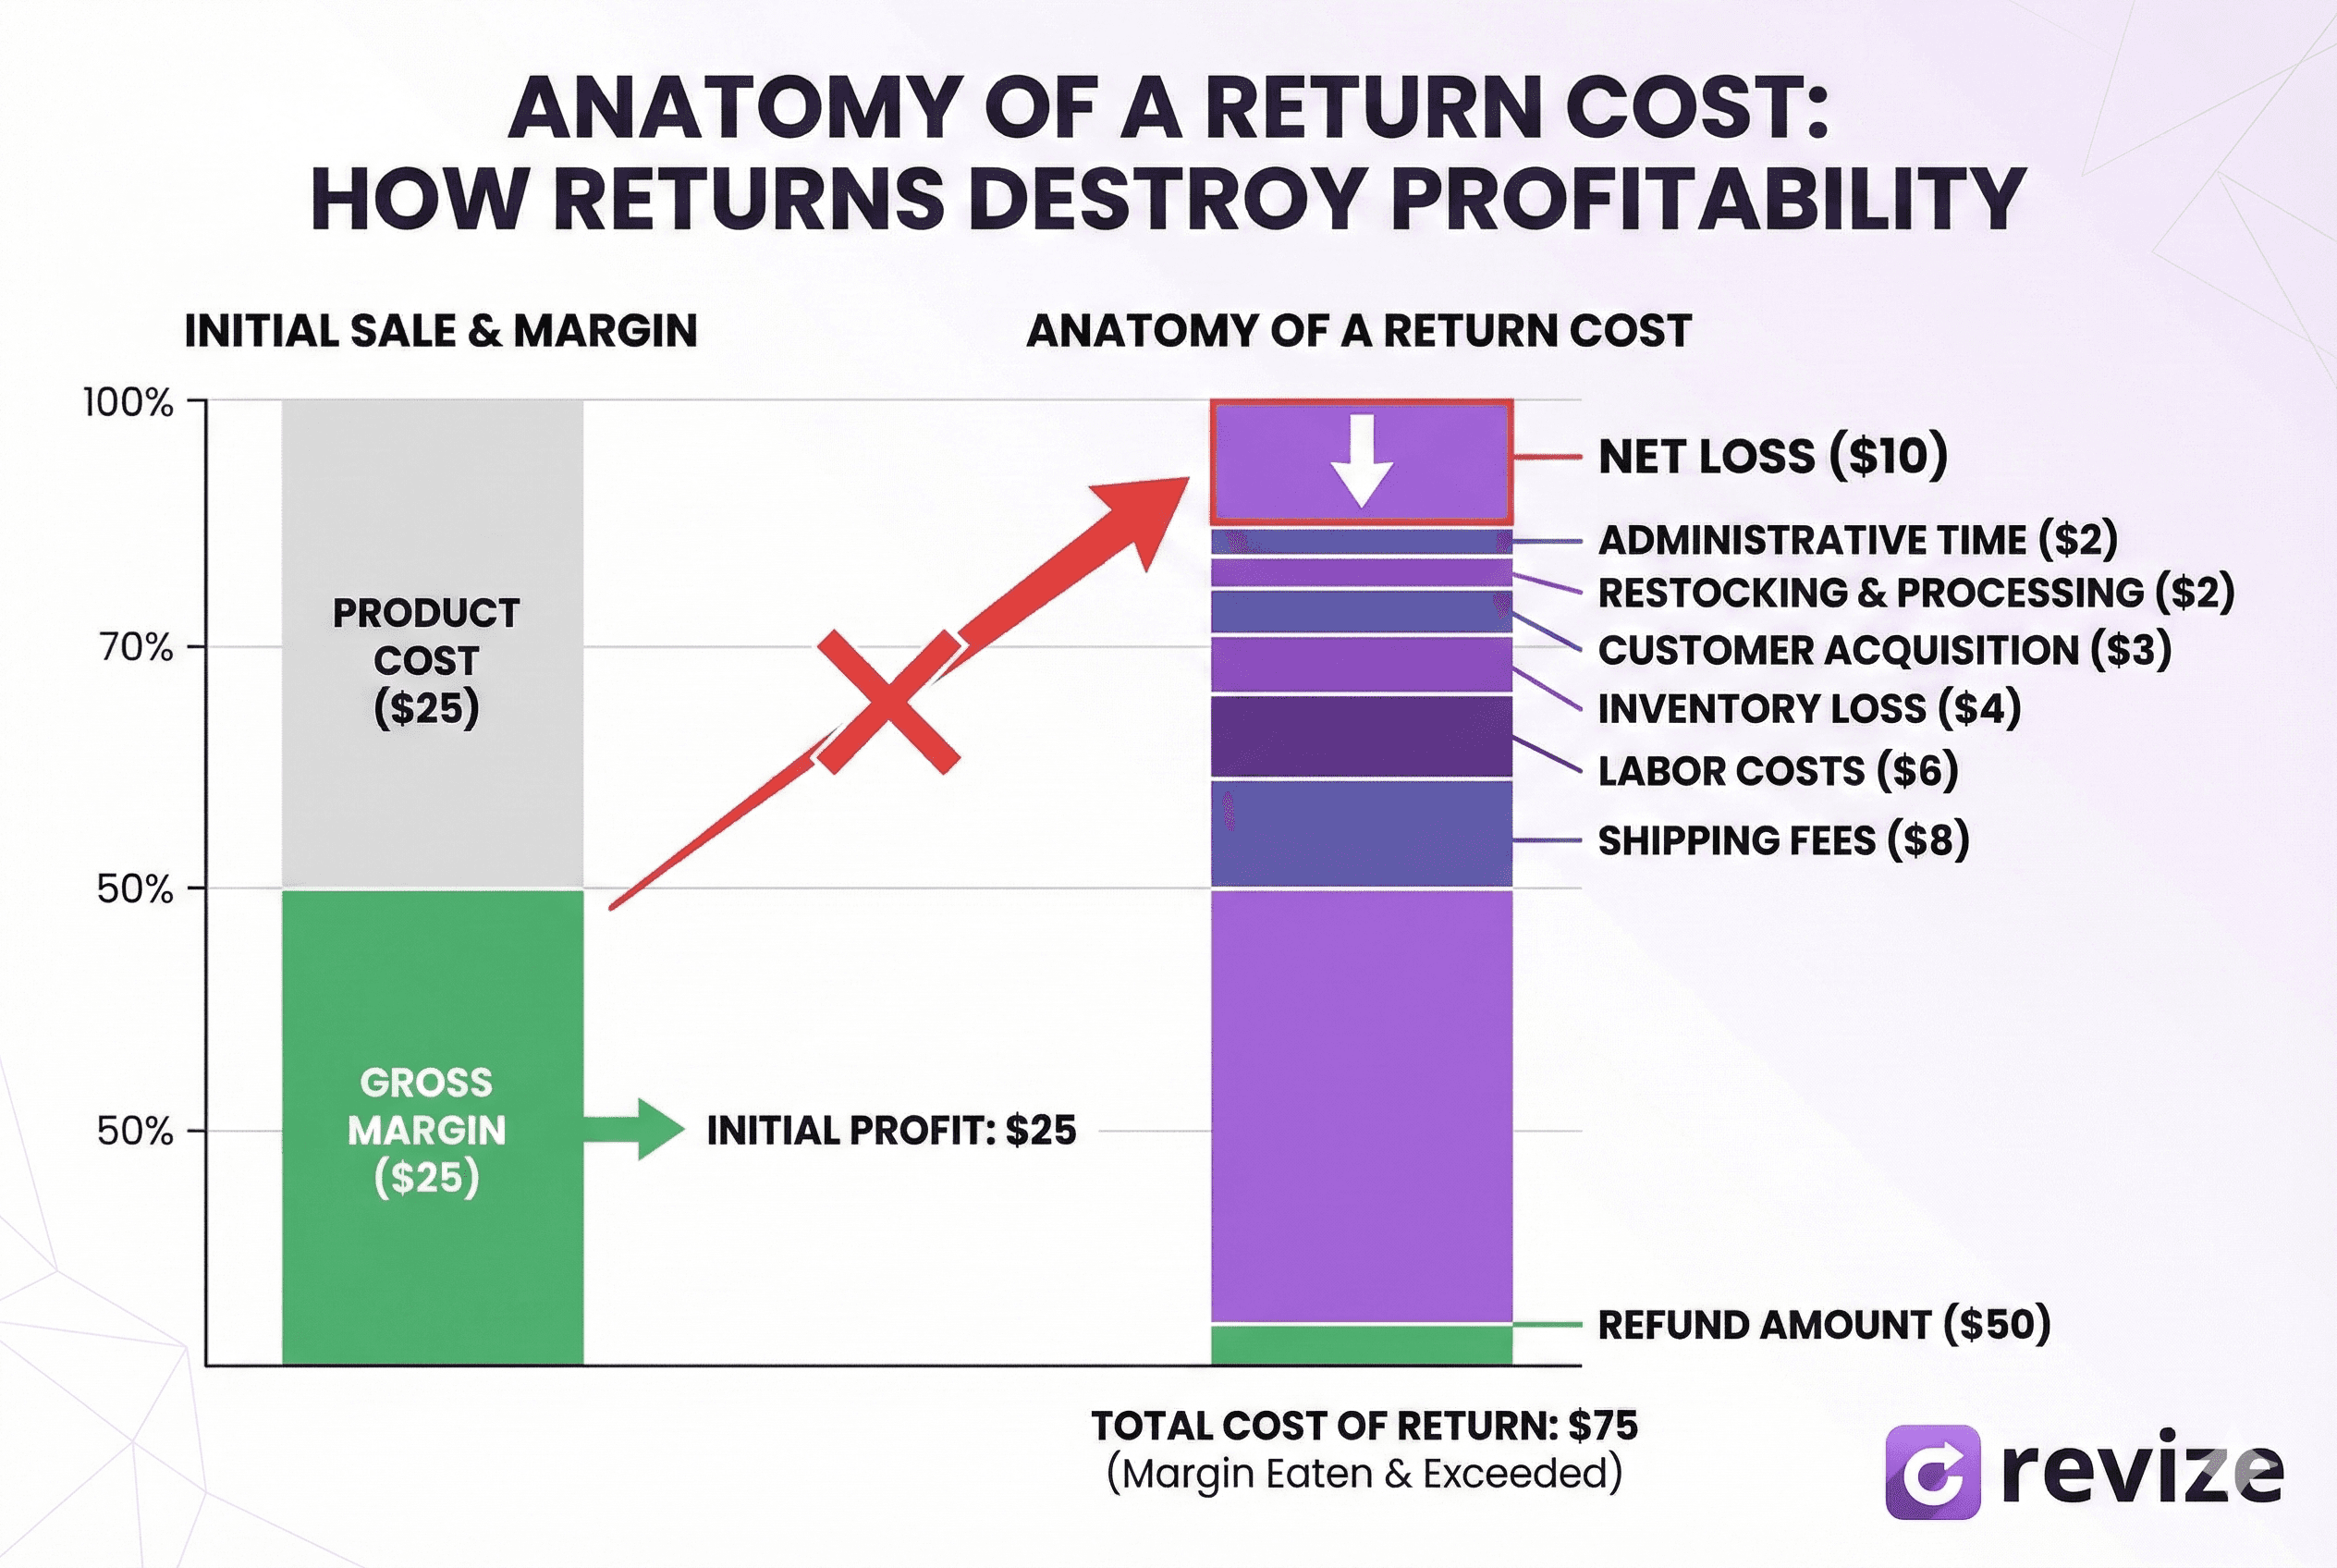
According to research from Optoro and various logistics studies, the average cost to process a single return ranges from $10 to $40, depending on the product category and how the return is handled.
For a $50 item with a $25 gross margin, a $20 return processing cost doesn't just eliminate your profit—it puts you underwater on that transaction.
Breaking Down the Cost Per Return
Here's where that $10-40 range comes from:
Cost Component | Low Estimate | High Estimate |
|---|---|---|
Return shipping (if you cover it) | $5 | $12 |
Warehouse receiving & inspection | $2 | $5 |
Restocking / repackaging | $1 | $4 |
Customer service labor | $2 | $6 |
Inventory depreciation | $0 | $15+ |
Payment processing fees (lost) | $1 | $3 |
Total per return | $11 | $45+ |
And this doesn't include the customer acquisition cost you spent to get that order in the first place. If you paid $15 in ad spend to acquire a customer who returns their purchase, that $15 is gone regardless.
The Hidden Costs Most Merchants Miss
The table above covers direct costs. But the real margin killers are the ones that don't show up on any single report.
1. Inventory Depreciation
A returned item is rarely worth what it was before it shipped.
Best case: it goes back on the shelf at full price. Reality: seasonal items are now off-season, fashion items are last month's trend, opened packaging means "open box" pricing, and some percentage just isn't resellable at all.
Industry data suggests 5-30% of returned merchandise can't be resold at full price. For fashion and electronics, that number skews higher.
A $100 jacket returned in January that you bought for $40? You might liquidate it for $30. That's not a return—that's a loss.
2. Operational Drag
Returns don't just cost money. They cost attention.
Every return is a disruption to your fulfillment flow. Staff who could be packing outbound orders are processing inbound returns. Inventory counts get complicated. Warehouse space gets consumed by "returns processing" limbo.
For Plus merchants doing serious volume, the operational drag of high return rates can bottleneck your entire fulfillment operation during peak periods.
3. Customer Lifetime Value Impact
Here's a counterintuitive data point: customers who return items are actually more likely to purchase again than customers who don't.
But—and this is critical—that's only true if the return experience was smooth.
A frustrating return experience doesn't just lose that customer. It generates negative reviews, social media complaints, and word-of-mouth damage that's impossible to quantify but very real.
The cost of a bad return experience isn't the $20 in processing. It's the lifetime value of every customer they tell.
4. The "Almost Return" You're Not Tracking
For every customer who actually returns an item, there are others who:
Wanted to return but it was too much hassle (they just won't buy again)
Did a chargeback instead of a return (you lose the item AND the money AND pay fees)
Kept the item but left a negative review
Kept the item but never purchased again
These "shadow returns" don't show up in your returns data, but they're eroding your business just the same.
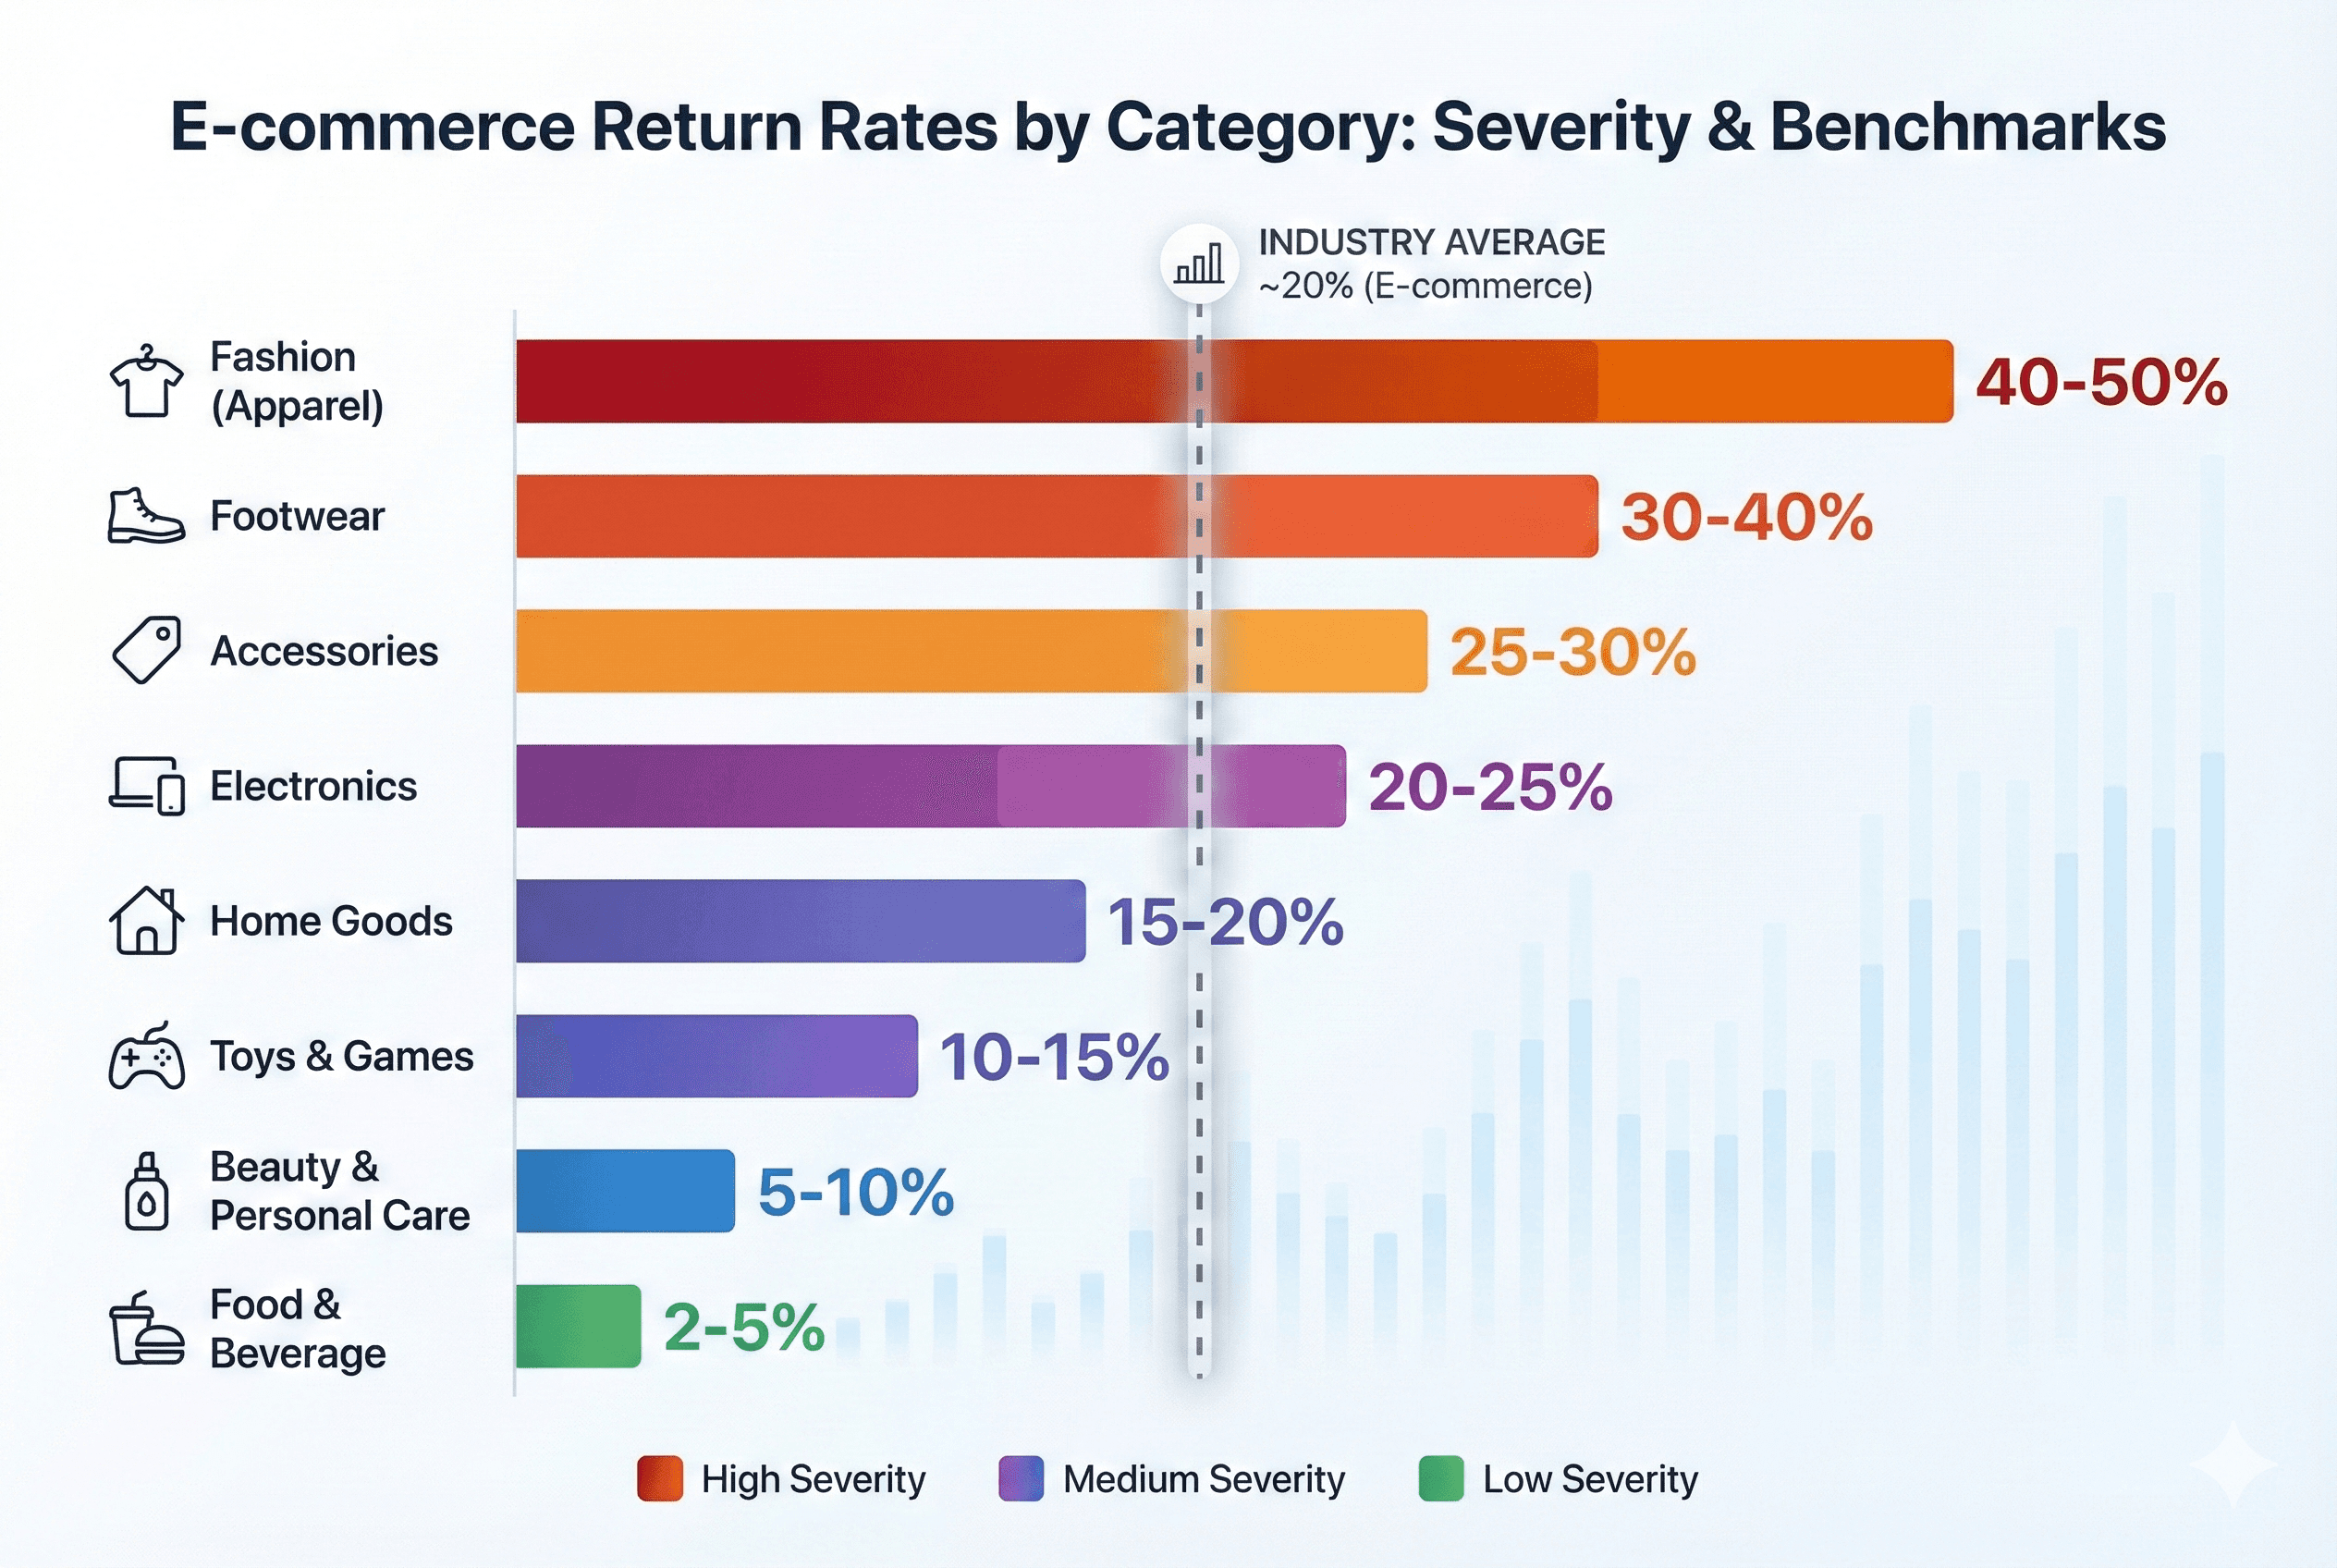
Return Rates by Category: Where Does Your Store Stand?
Not all product categories are equal. Here's what typical return rates look like:
Category | Average Return Rate | Primary Reasons |
|---|---|---|
Apparel & Fashion | 25-40% | Fit, color different than expected |
Footwear | 20-30% | Sizing issues |
Electronics | 15-20% | Didn't meet expectations, compatibility |
Home & Furniture | 10-20% | Size, color, damage in transit |
Beauty & Cosmetics | 5-15% | Allergic reaction, wrong shade |
Food & Beverage | 2-5% | Damage, wrong item |
If you're significantly above these benchmarks, you have a product page problem, a sizing problem, or a quality problem. If you're at or below, you're doing something right—but there's still room to optimize.
Why Customers Return: The Data Behind the Decision
Understanding why returns happen is the first step to preventing them. Here's what the data shows:
Top Return Reasons (E-commerce)
Wrong size/fit — 42%
Item different than described/pictured — 22%
Changed mind / no longer needed — 15%
Item damaged or defective — 12%
Wrong item received — 5%
Other — 4%
Look at that first number. 42% of returns are sizing-related.
This is why apparel and footwear have the highest return rates. And it's why the solution isn't just "better return processing"—it's preventing the wrong size from shipping in the first place.
The "Bracketing" Problem
A growing behavior, especially in fashion: customers intentionally order multiple sizes planning to return what doesn't fit.
This isn't fraud—it's rational behavior in response to inconsistent sizing and the hassle of exchanges. But it means your return rate isn't just about mistakes. It's about customers using returns as a try-on service.
Some brands have leaned into this (Stitch Fix, Warby Parker's home try-on). Most are just absorbing the cost without a strategy.
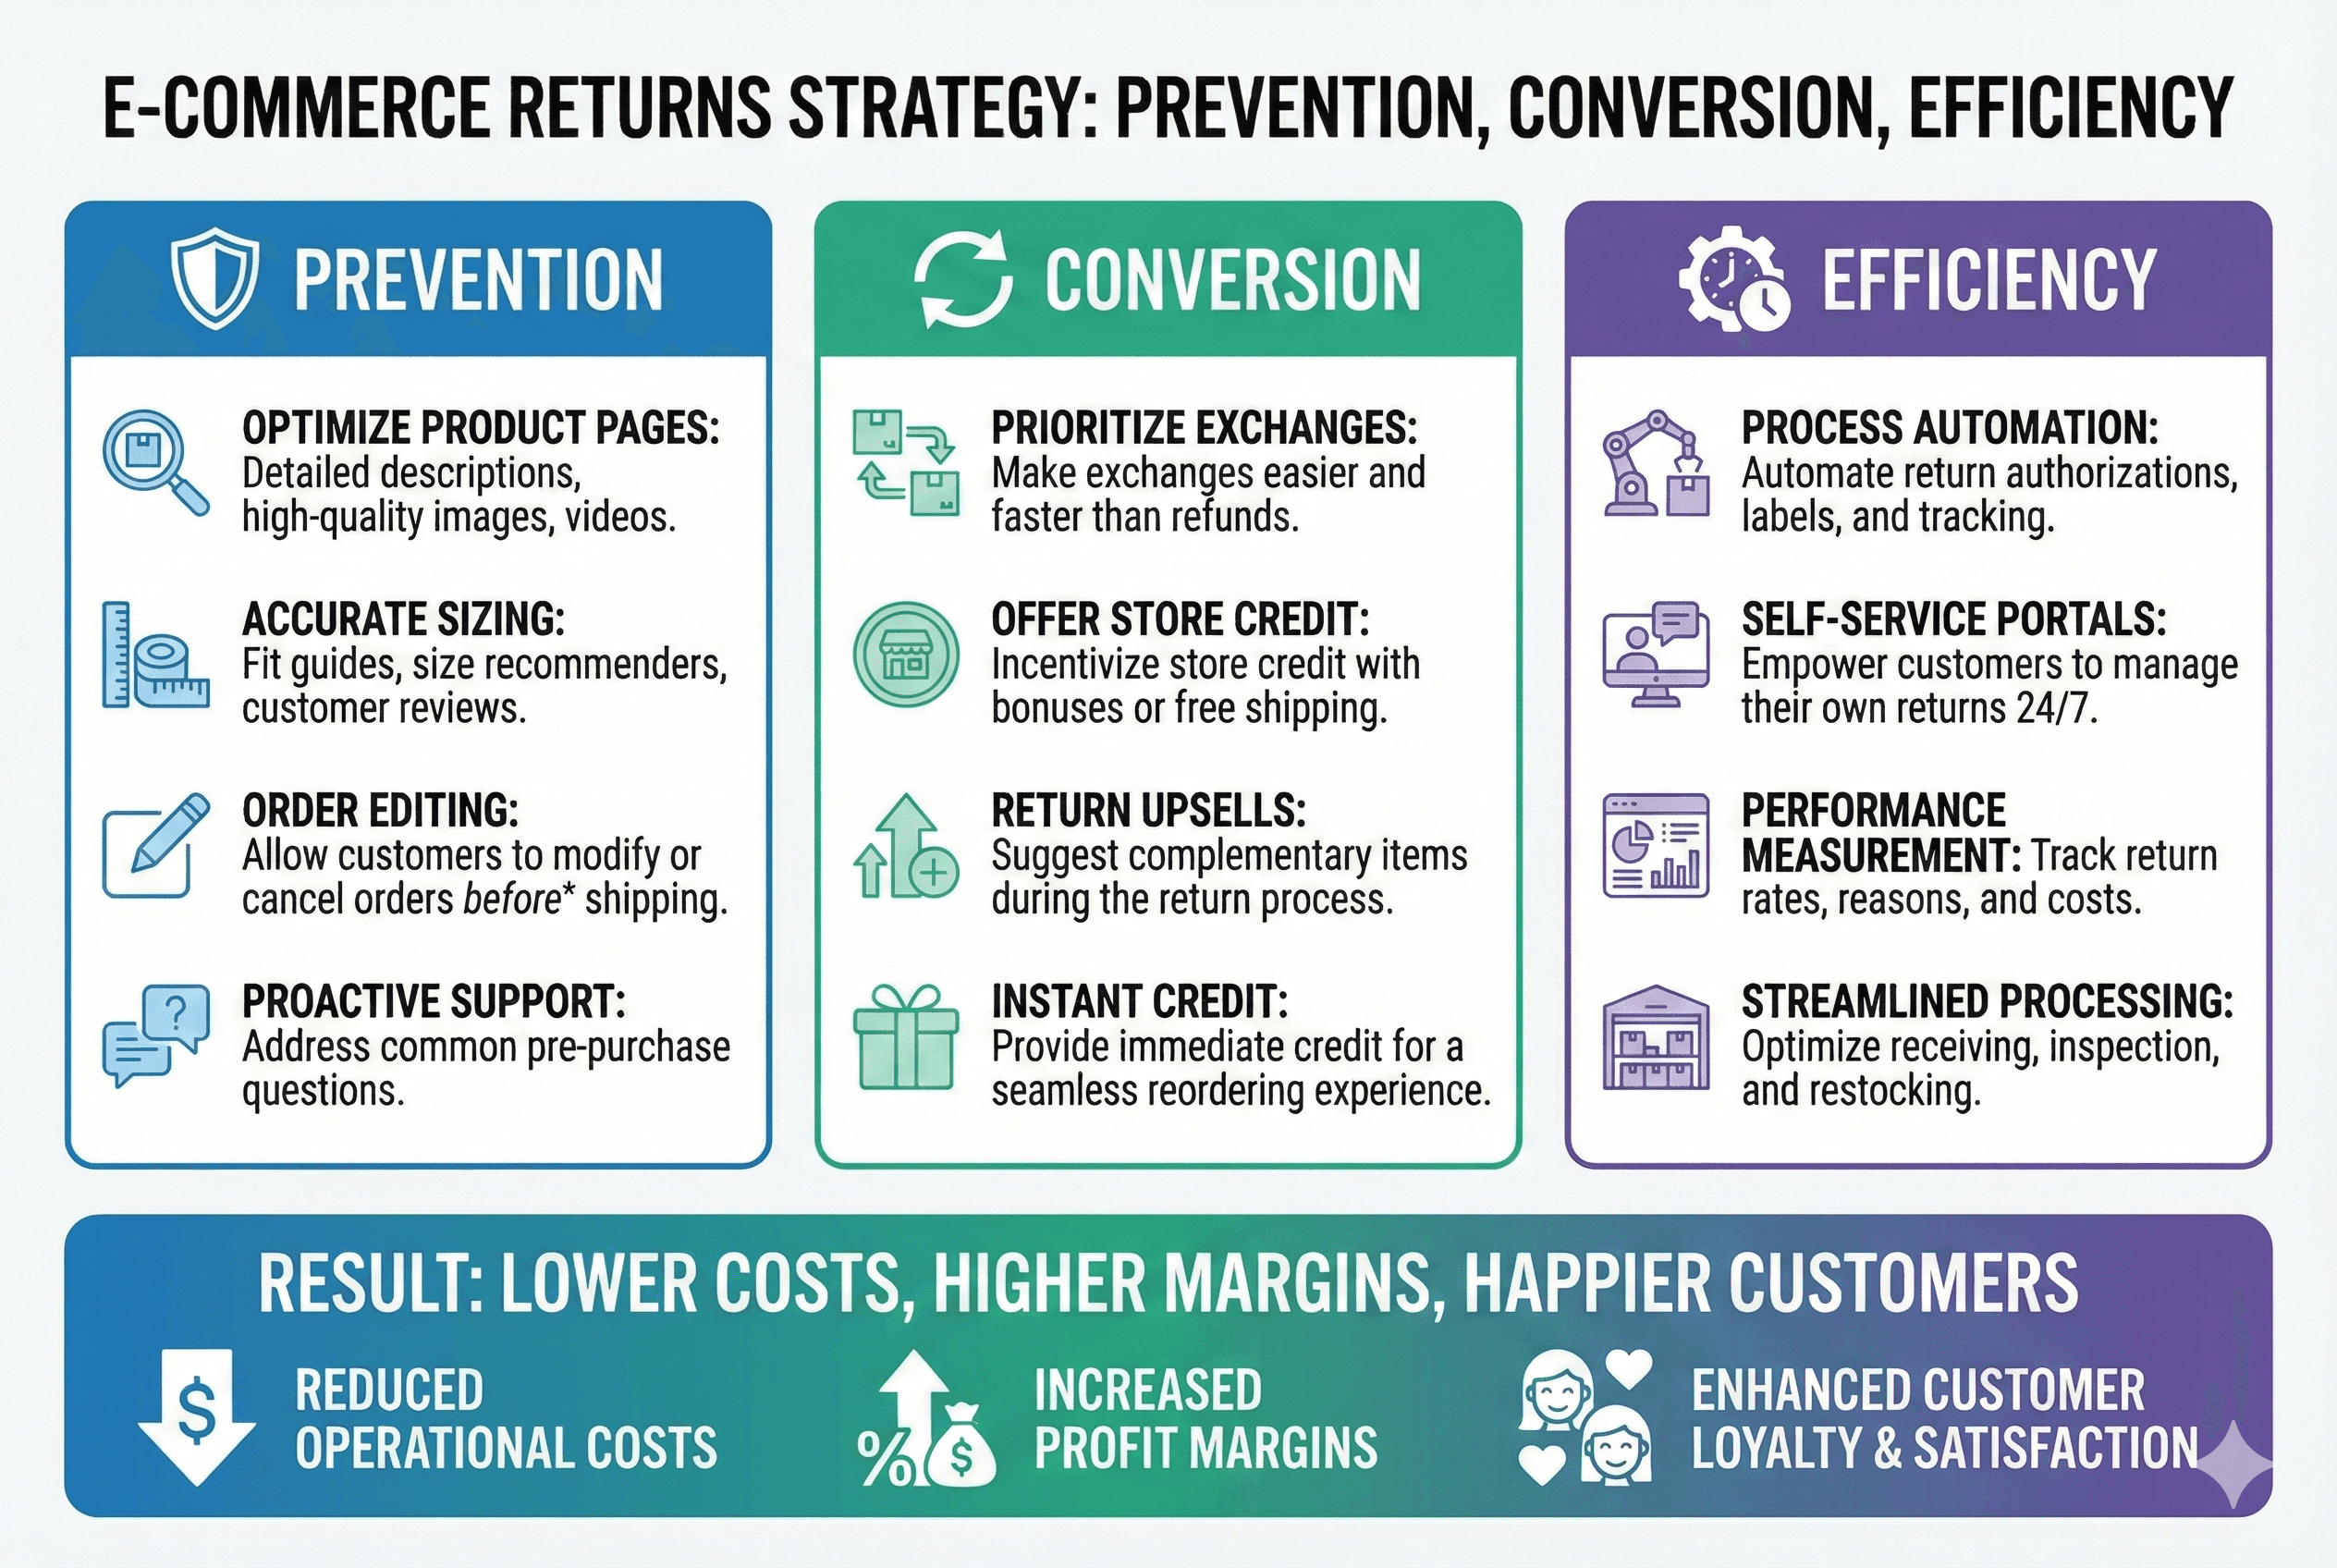
The Prevention Playbook: Reducing Returns Before They Happen
The most profitable approach to returns is preventing them. Here's what actually works:
1. Fix Your Product Pages
If 22% of returns are "item different than expected," your product pages are failing.
What to audit:
Photography: Multiple angles, zoom capability, lifestyle shots showing scale
Videos: 15-30 second product videos reduce returns by up to 25%
Descriptions: Specific measurements, materials, use cases—not marketing fluff
Reviews: Enable photo reviews; real customer photos set accurate expectations
The test: Can a customer understand exactly what they're getting without any imagination required? If they have to guess at anything, that's a return waiting to happen.
2. Solve the Sizing Problem
42% of returns are fit-related. This is a solvable problem.
Options:
Size guides with actual measurements: Not just S/M/L, but chest, waist, length in inches/cm
Fit predictor tools: Apps that use past purchase data or body measurements to recommend sizes
"How it fits" information: "Runs small," "oversized fit," "order one size up"
Customer reviews with size context: "I'm 5'8", 160lbs, the medium fits perfectly"
Every percentage point reduction in size-related returns goes straight to your margin.
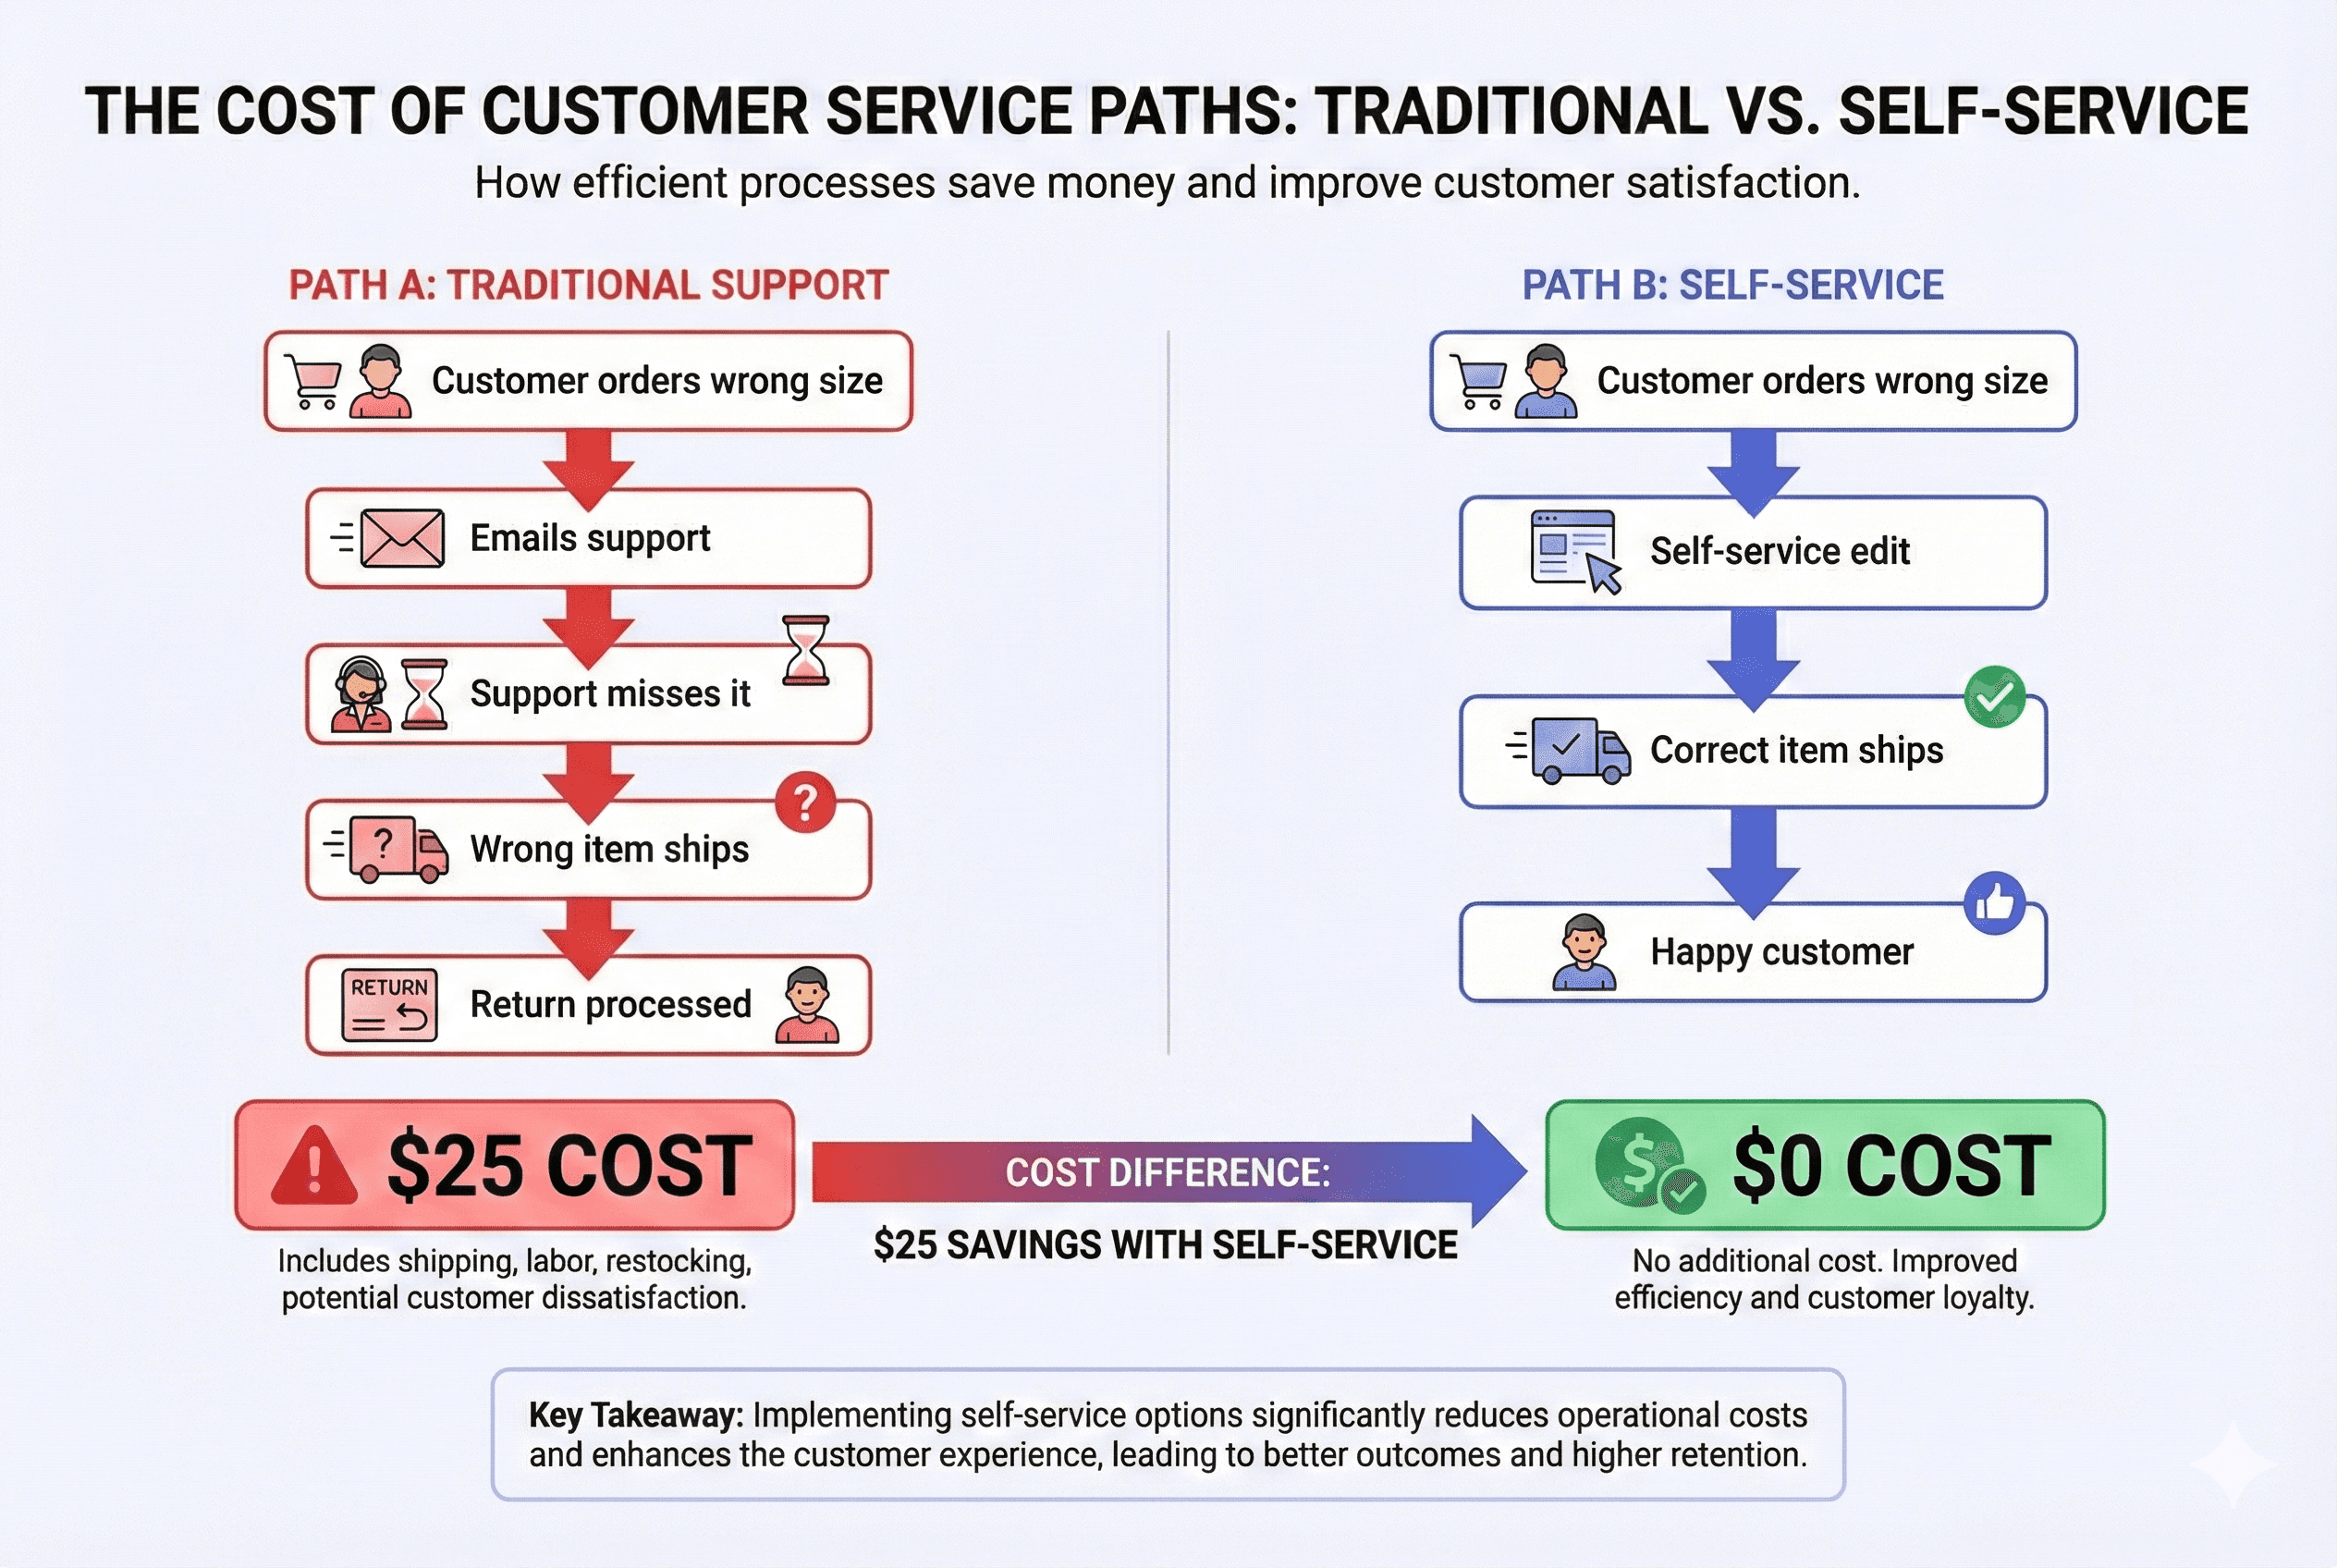
3. Enable Pre-Shipment Changes
Here's the scenario that plays out thousands of times daily across Shopify:
Customer orders a medium blue shirt
Customer realizes immediately they wanted large (or wanted green)
Customer emails support: "Can I change my order?"
Support either catches it in time... or doesn't
If they don't: wrong item ships → guaranteed return
The math: A return costs you $15-40. A pre-shipment order change costs you nothing (or generates additional revenue if they're adding items).
Yet most stores make it nearly impossible for customers to modify orders after checkout. The "edit order" functionality exists in Shopify, but it's merchant-side only. Customers have to email and hope.
Self-service order editing—letting customers change sizes, colors, or shipping details before fulfillment—converts what would be a $25 return cost into a $0 modification.
The best solutions handle the complexity automatically: when a customer updates their address, shipping costs and taxes recalculate instantly. If the new address is closer to a different fulfillment center, warehouse assignment updates too. No manual adjustments, no revenue leakage, no support ticket required.
4. Proactive Communication
Sometimes customers change their mind between ordering and delivery. A week is a long time.
What helps:
Immediate order confirmation with clear "need to make changes?" messaging
Shipping notification with delivery date expectation-setting
Delivery notification with "how to return if needed" (reduces friction, paradoxically reduces returns)
The stores with lowest return rates aren't the ones who make returns difficult. They're the ones who set accurate expectations at every touchpoint.
5. Quality Control
12% of returns are damaged or defective items. This is entirely within your control.
If you fulfill in-house: Implement inspection checkpoints before shipping
If you use 3PL: Audit their damage rates; hold them accountable to standards
For fragile items: Invest in packaging. The $2 you save on cheaper boxes costs $20 when the item arrives broken.
The Return Experience: When Prevention Fails
You won't prevent every return. When they happen, how you handle them determines whether you retain the customer.
The Friction Tradeoff
Making returns difficult reduces return rates. It also reduces repeat purchases and generates negative reviews.
Research from Narvar shows that 96% of customers would shop with a retailer again based on an easy return experience. Make it painful, and you've saved $20 on this return while losing hundreds in future LTV.
The play isn't friction—it's conversion.
Convert Returns to Exchanges
A return is lost revenue. An exchange retains revenue (and often increases it).
If a customer wants to return a $50 shirt, offer:
Exchange for different size/color (you keep the $50)
Store credit with a bonus (return $50, get $55 credit—you keep them in ecosystem)
Exchange + upsell (swap the shirt, add a belt at 20% off)
Returns platforms like Loop, ReturnGO, and others have built entire businesses around this conversion concept. The data is clear: exchanges retain 30-40% of revenue that would otherwise be refunded.
The Speed Factor
How quickly you process returns matters more than you'd think.
A customer waiting 2 weeks for a refund is anxious, frustrated, and writing negative reviews. A customer refunded in 48 hours is relieved and more likely to order again.
If you're holding refunds waiting for items to arrive and be inspected, you're trading float for goodwill. For most stores, instant refunds on initiation (with fraud controls) net out better than slow, verified refunds.
Measuring What Matters: Return Metrics to Track
You can't improve what you don't measure. Here's what to track:
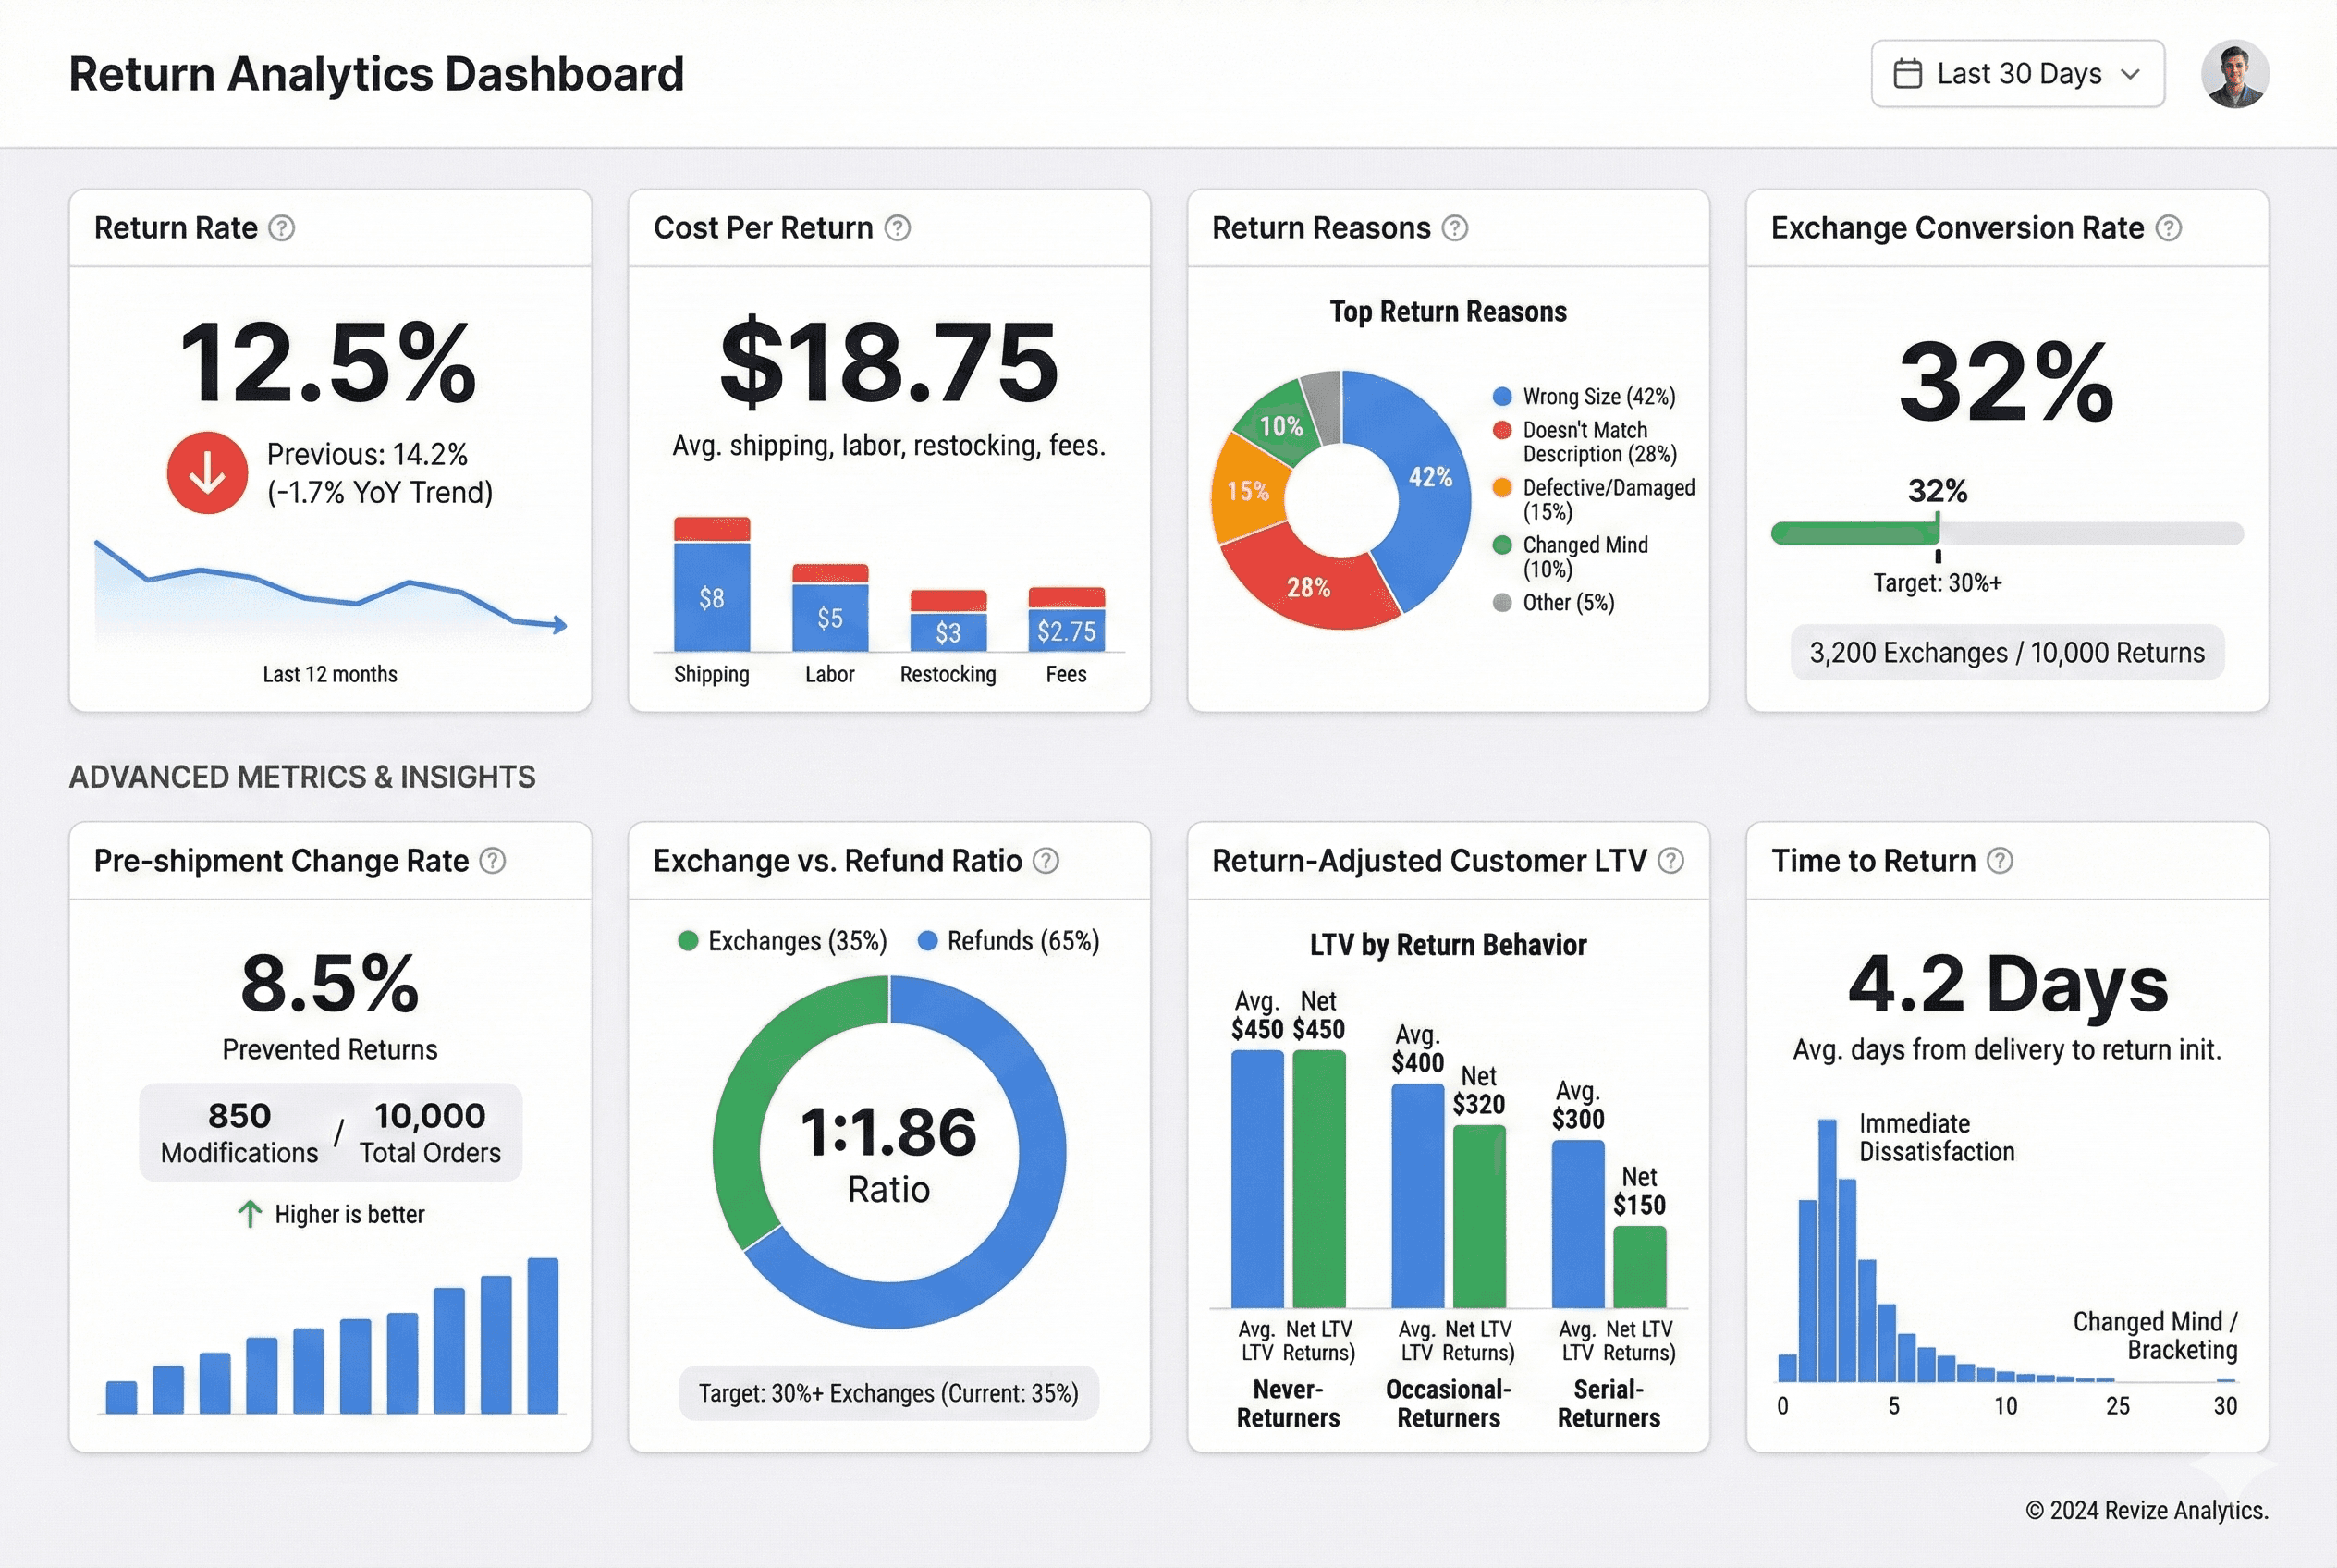
Core Metrics
Return rate: Returns / Orders shipped. Track overall and by category/product.
Cost per return: Total return-related costs / Number of returns. Include everything: shipping, labor, inventory write-downs, customer service time.
Return reason breakdown: Categorize every return by reason. If 50% are "wrong size," that's a different problem than 50% "didn't like it."
Net recovery rate: Revenue recovered from returned items (resold, exchanged, liquidated) / Original value. How much value are you actually losing?
Advanced Metrics
Pre-shipment change rate: Order modifications before fulfillment / Total orders. Higher is better—these are prevented returns.
Exchange vs. refund ratio: Of all returns initiated, how many convert to exchanges? Target: 30%+ exchanges.
Return-adjusted customer LTV: Segment customers by return behavior. What's the LTV of never-returners vs. occasional-returners vs. serial-returners?
Time to return: Average days between delivery and return initiation. Shorter times suggest immediate dissatisfaction (quality/expectation issues). Longer times suggest "changed mind" or bracketing.
The Plus Merchant Perspective: Returns at Scale
For Shopify Plus merchants, returns aren't just a customer service issue—they're an operational and financial planning issue.
At 10,000+ Orders/Month
At this volume, even a 1% improvement in return rate is meaningful:
10,000 orders × 20% return rate = 2,000 returns
10,000 orders × 19% return rate = 1,900 returns
100 fewer returns × $25 cost = $2,500/month saved
That's $30,000 annually from a one-percentage-point improvement.
The Ops Complexity
Returns at scale create cascading operational challenges:
Inventory accuracy: Returns in transit create phantom inventory. Systems show "in stock" for items sitting in UPS trucks.
Warehouse throughput: Returns processing competes with outbound fulfillment for labor and space.
Financial reconciliation: Returns hit across accounting periods, complicating revenue recognition and inventory valuation.
Forecasting: High return rates make demand planning unreliable. Did you sell 10,000 units or 7,500 after returns?
Plus merchants need returns systems, not just returns policies.
What Enterprise Stores Do Differently
The Plus merchants with healthiest return economics:
Treat returns as a product problem, not a logistics problem. They fix root causes (product pages, sizing, quality) rather than just processing symptoms efficiently.
Build self-service into everything. Pre-shipment edits, automated returns portals, instant refunds. Humans handle exceptions, not routine transactions.
Optimize for exchange, not just return. Their returns flow pushes toward exchanges and store credit before offering refunds.
Measure obsessively. Return metrics sit alongside revenue and conversion rate in executive dashboards.
Invest in prevention. They'd rather spend $10,000 on better product photography than $50,000 processing preventable returns.
Building Your Return Cost Reduction Plan
Here's a practical framework for attacking return costs:
Phase 1: Understand Your Baseline (Week 1-2)
Calculate your true cost per return (all components)
Analyze return reasons for the last 90 days
Identify your top 3 most-returned products
Benchmark your return rate against category averages
Phase 2: Fix the Obvious (Week 3-6)
Audit and improve product pages for top returned items
Add/improve size guides for apparel
Enable pre-shipment order modifications (self-service if possible)
Implement instant returns portal if you're still processing via email
Phase 3: Optimize the Flow (Week 7-12)
Set up exchange-first return flow
Add bonus credit incentive for exchanges over refunds
Implement return reason tagging with automation
Build return metrics dashboard
Phase 4: Continuous Improvement (Ongoing)
Weekly review of return metrics
Monthly product-level return analysis
Quarterly review of returns policy effectiveness
Ongoing A/B testing of prevention tactics
The Bottom Line
Returns are a cost of doing business in e-commerce. But they don't have to be an uncontrolled cost.
The merchants who win on profitability aren't the ones with the lowest return rates (though that helps). They're the ones who:
Understand the true cost beyond the refund amount
Prevent returns through better product information and pre-shipment flexibility
Convert returns to exchanges to retain revenue
Process efficiently to minimize operational drag
Measure and improve continuously
A 20% return rate isn't destiny. It's a starting point.
Every percentage point you shave off goes directly to margin. Every return you convert to an exchange keeps revenue in your ecosystem. Every order edit that prevents a return saves $20+ in processing costs.
The question isn't whether you can afford to invest in return reduction. It's whether you can afford not to.
Frequently Asked Questions
What's a "good" return rate for e-commerce?
It varies by category. Fashion: 20-30% is normal, under 20% is good. Electronics: 10-15% is normal. Home goods: 8-12% is typical. Compare yourself to category benchmarks, not overall e-commerce averages.
Should I offer free returns?
It depends on your margins and competitive landscape. Free returns increase conversion but also increase return rates. Many brands now offer free exchanges but charge for refund returns—a middle ground that encourages retention.
How do I handle serial returners?
First, identify them (return rate >50% over multiple orders). Then decide: are they unprofitable customers you should discourage, or high-volume customers whose lifetime value still justifies the returns? Some brands limit return privileges for serial returners; others accept it as cost of doing business.
What's the ROI of returns management software?
Typical returns platforms cost $100-500/month for mid-size stores. If they convert even 10% more returns to exchanges and save 2 hours/week of manual processing, they pay for themselves quickly. For Plus merchants, the ROI is usually obvious within 30 days.
How do pre-shipment order edits reduce returns?
When customers can fix mistakes (wrong size, wrong color, wrong address) before the item ships, you prevent returns at the source. A size swap before fulfillment costs nothing. A size swap after delivery costs $25+ in return processing.
What's the biggest mistake merchants make with returns?
Treating returns as purely a logistics/customer service problem rather than a product and information problem. The lowest-cost way to handle a return is to prevent it from happening.
Prevent returns before they happen. Revize Order Editing lets your customers edit their orders—change sizes, colors, quantities, and shipping details—before you ship. Shipping, taxes, and warehouse assignment recalculate automatically. Every edit is a return prevented. Try it free →
Related Resources
Returns are the tax nobody budgets for.
You know the number on your returns report. The refund amount. Maybe the restocking fees you charge (or don't). But that number is lying to you.
The actual cost of a return is 3-4x what most merchants think. And at scale—especially for Shopify Plus stores doing thousands of orders monthly—that gap between perceived cost and real cost is the difference between healthy margins and wondering where all the profit went.
This guide breaks down exactly what returns actually cost, where the hidden fees live, and what the most profitable stores do differently.
The Numbers: What Returns Actually Cost in 2026
Let's start with the macro picture, then zoom into what this means for your store.
Industry-Wide Return Costs
The National Retail Federation estimates that $743 billion worth of merchandise was returned in 2024. For online retail specifically, return rates hover between 20-30%, compared to 8-10% for brick-and-mortar.
But the return rate isn't the scary number. The cost per return is.
According to research from Optoro and various logistics studies, the average cost to process a single return ranges from $10 to $40, depending on the product category and how the return is handled.
For a $50 item with a $25 gross margin, a $20 return processing cost doesn't just eliminate your profit—it puts you underwater on that transaction.
Breaking Down the Cost Per Return
Here's where that $10-40 range comes from:
Cost Component | Low Estimate | High Estimate |
|---|---|---|
Return shipping (if you cover it) | $5 | $12 |
Warehouse receiving & inspection | $2 | $5 |
Restocking / repackaging | $1 | $4 |
Customer service labor | $2 | $6 |
Inventory depreciation | $0 | $15+ |
Payment processing fees (lost) | $1 | $3 |
Total per return | $11 | $45+ |
And this doesn't include the customer acquisition cost you spent to get that order in the first place. If you paid $15 in ad spend to acquire a customer who returns their purchase, that $15 is gone regardless.
The Hidden Costs Most Merchants Miss
The table above covers direct costs. But the real margin killers are the ones that don't show up on any single report.
1. Inventory Depreciation
A returned item is rarely worth what it was before it shipped.
Best case: it goes back on the shelf at full price. Reality: seasonal items are now off-season, fashion items are last month's trend, opened packaging means "open box" pricing, and some percentage just isn't resellable at all.
Industry data suggests 5-30% of returned merchandise can't be resold at full price. For fashion and electronics, that number skews higher.
A $100 jacket returned in January that you bought for $40? You might liquidate it for $30. That's not a return—that's a loss.
2. Operational Drag
Returns don't just cost money. They cost attention.
Every return is a disruption to your fulfillment flow. Staff who could be packing outbound orders are processing inbound returns. Inventory counts get complicated. Warehouse space gets consumed by "returns processing" limbo.
For Plus merchants doing serious volume, the operational drag of high return rates can bottleneck your entire fulfillment operation during peak periods.
3. Customer Lifetime Value Impact
Here's a counterintuitive data point: customers who return items are actually more likely to purchase again than customers who don't.
But—and this is critical—that's only true if the return experience was smooth.
A frustrating return experience doesn't just lose that customer. It generates negative reviews, social media complaints, and word-of-mouth damage that's impossible to quantify but very real.
The cost of a bad return experience isn't the $20 in processing. It's the lifetime value of every customer they tell.
4. The "Almost Return" You're Not Tracking
For every customer who actually returns an item, there are others who:
Wanted to return but it was too much hassle (they just won't buy again)
Did a chargeback instead of a return (you lose the item AND the money AND pay fees)
Kept the item but left a negative review
Kept the item but never purchased again
These "shadow returns" don't show up in your returns data, but they're eroding your business just the same.
Return Rates by Category: Where Does Your Store Stand?
Not all product categories are equal. Here's what typical return rates look like:
Category | Average Return Rate | Primary Reasons |
|---|---|---|
Apparel & Fashion | 25-40% | Fit, color different than expected |
Footwear | 20-30% | Sizing issues |
Electronics | 15-20% | Didn't meet expectations, compatibility |
Home & Furniture | 10-20% | Size, color, damage in transit |
Beauty & Cosmetics | 5-15% | Allergic reaction, wrong shade |
Food & Beverage | 2-5% | Damage, wrong item |
If you're significantly above these benchmarks, you have a product page problem, a sizing problem, or a quality problem. If you're at or below, you're doing something right—but there's still room to optimize.
Why Customers Return: The Data Behind the Decision
Understanding why returns happen is the first step to preventing them. Here's what the data shows:
Top Return Reasons (E-commerce)
Wrong size/fit — 42%
Item different than described/pictured — 22%
Changed mind / no longer needed — 15%
Item damaged or defective — 12%
Wrong item received — 5%
Other — 4%
Look at that first number. 42% of returns are sizing-related.
This is why apparel and footwear have the highest return rates. And it's why the solution isn't just "better return processing"—it's preventing the wrong size from shipping in the first place.
The "Bracketing" Problem
A growing behavior, especially in fashion: customers intentionally order multiple sizes planning to return what doesn't fit.
This isn't fraud—it's rational behavior in response to inconsistent sizing and the hassle of exchanges. But it means your return rate isn't just about mistakes. It's about customers using returns as a try-on service.
Some brands have leaned into this (Stitch Fix, Warby Parker's home try-on). Most are just absorbing the cost without a strategy.
The Prevention Playbook: Reducing Returns Before They Happen
The most profitable approach to returns is preventing them. Here's what actually works:
1. Fix Your Product Pages
If 22% of returns are "item different than expected," your product pages are failing.
What to audit:
Photography: Multiple angles, zoom capability, lifestyle shots showing scale
Videos: 15-30 second product videos reduce returns by up to 25%
Descriptions: Specific measurements, materials, use cases—not marketing fluff
Reviews: Enable photo reviews; real customer photos set accurate expectations
The test: Can a customer understand exactly what they're getting without any imagination required? If they have to guess at anything, that's a return waiting to happen.
2. Solve the Sizing Problem
42% of returns are fit-related. This is a solvable problem.
Options:
Size guides with actual measurements: Not just S/M/L, but chest, waist, length in inches/cm
Fit predictor tools: Apps that use past purchase data or body measurements to recommend sizes
"How it fits" information: "Runs small," "oversized fit," "order one size up"
Customer reviews with size context: "I'm 5'8", 160lbs, the medium fits perfectly"
Every percentage point reduction in size-related returns goes straight to your margin.
3. Enable Pre-Shipment Changes
Here's the scenario that plays out thousands of times daily across Shopify:
Customer orders a medium blue shirt
Customer realizes immediately they wanted large (or wanted green)
Customer emails support: "Can I change my order?"
Support either catches it in time... or doesn't
If they don't: wrong item ships → guaranteed return
The math: A return costs you $15-40. A pre-shipment order change costs you nothing (or generates additional revenue if they're adding items).
Yet most stores make it nearly impossible for customers to modify orders after checkout. The "edit order" functionality exists in Shopify, but it's merchant-side only. Customers have to email and hope.
Self-service order editing—letting customers change sizes, colors, or shipping details before fulfillment—converts what would be a $25 return cost into a $0 modification.
The best solutions handle the complexity automatically: when a customer updates their address, shipping costs and taxes recalculate instantly. If the new address is closer to a different fulfillment center, warehouse assignment updates too. No manual adjustments, no revenue leakage, no support ticket required.
4. Proactive Communication
Sometimes customers change their mind between ordering and delivery. A week is a long time.
What helps:
Immediate order confirmation with clear "need to make changes?" messaging
Shipping notification with delivery date expectation-setting
Delivery notification with "how to return if needed" (reduces friction, paradoxically reduces returns)
The stores with lowest return rates aren't the ones who make returns difficult. They're the ones who set accurate expectations at every touchpoint.
5. Quality Control
12% of returns are damaged or defective items. This is entirely within your control.
If you fulfill in-house: Implement inspection checkpoints before shipping
If you use 3PL: Audit their damage rates; hold them accountable to standards
For fragile items: Invest in packaging. The $2 you save on cheaper boxes costs $20 when the item arrives broken.
The Return Experience: When Prevention Fails
You won't prevent every return. When they happen, how you handle them determines whether you retain the customer.
The Friction Tradeoff
Making returns difficult reduces return rates. It also reduces repeat purchases and generates negative reviews.
Research from Narvar shows that 96% of customers would shop with a retailer again based on an easy return experience. Make it painful, and you've saved $20 on this return while losing hundreds in future LTV.
The play isn't friction—it's conversion.
Convert Returns to Exchanges
A return is lost revenue. An exchange retains revenue (and often increases it).
If a customer wants to return a $50 shirt, offer:
Exchange for different size/color (you keep the $50)
Store credit with a bonus (return $50, get $55 credit—you keep them in ecosystem)
Exchange + upsell (swap the shirt, add a belt at 20% off)
Returns platforms like Loop, ReturnGO, and others have built entire businesses around this conversion concept. The data is clear: exchanges retain 30-40% of revenue that would otherwise be refunded.
The Speed Factor
How quickly you process returns matters more than you'd think.
A customer waiting 2 weeks for a refund is anxious, frustrated, and writing negative reviews. A customer refunded in 48 hours is relieved and more likely to order again.
If you're holding refunds waiting for items to arrive and be inspected, you're trading float for goodwill. For most stores, instant refunds on initiation (with fraud controls) net out better than slow, verified refunds.
Measuring What Matters: Return Metrics to Track
You can't improve what you don't measure. Here's what to track:
Core Metrics
Return rate: Returns / Orders shipped. Track overall and by category/product.
Cost per return: Total return-related costs / Number of returns. Include everything: shipping, labor, inventory write-downs, customer service time.
Return reason breakdown: Categorize every return by reason. If 50% are "wrong size," that's a different problem than 50% "didn't like it."
Net recovery rate: Revenue recovered from returned items (resold, exchanged, liquidated) / Original value. How much value are you actually losing?
Advanced Metrics
Pre-shipment change rate: Order modifications before fulfillment / Total orders. Higher is better—these are prevented returns.
Exchange vs. refund ratio: Of all returns initiated, how many convert to exchanges? Target: 30%+ exchanges.
Return-adjusted customer LTV: Segment customers by return behavior. What's the LTV of never-returners vs. occasional-returners vs. serial-returners?
Time to return: Average days between delivery and return initiation. Shorter times suggest immediate dissatisfaction (quality/expectation issues). Longer times suggest "changed mind" or bracketing.
The Plus Merchant Perspective: Returns at Scale
For Shopify Plus merchants, returns aren't just a customer service issue—they're an operational and financial planning issue.
At 10,000+ Orders/Month
At this volume, even a 1% improvement in return rate is meaningful:
10,000 orders × 20% return rate = 2,000 returns
10,000 orders × 19% return rate = 1,900 returns
100 fewer returns × $25 cost = $2,500/month saved
That's $30,000 annually from a one-percentage-point improvement.
The Ops Complexity
Returns at scale create cascading operational challenges:
Inventory accuracy: Returns in transit create phantom inventory. Systems show "in stock" for items sitting in UPS trucks.
Warehouse throughput: Returns processing competes with outbound fulfillment for labor and space.
Financial reconciliation: Returns hit across accounting periods, complicating revenue recognition and inventory valuation.
Forecasting: High return rates make demand planning unreliable. Did you sell 10,000 units or 7,500 after returns?
Plus merchants need returns systems, not just returns policies.
What Enterprise Stores Do Differently
The Plus merchants with healthiest return economics:
Treat returns as a product problem, not a logistics problem. They fix root causes (product pages, sizing, quality) rather than just processing symptoms efficiently.
Build self-service into everything. Pre-shipment edits, automated returns portals, instant refunds. Humans handle exceptions, not routine transactions.
Optimize for exchange, not just return. Their returns flow pushes toward exchanges and store credit before offering refunds.
Measure obsessively. Return metrics sit alongside revenue and conversion rate in executive dashboards.
Invest in prevention. They'd rather spend $10,000 on better product photography than $50,000 processing preventable returns.
Building Your Return Cost Reduction Plan
Here's a practical framework for attacking return costs:
Phase 1: Understand Your Baseline (Week 1-2)
Calculate your true cost per return (all components)
Analyze return reasons for the last 90 days
Identify your top 3 most-returned products
Benchmark your return rate against category averages
Phase 2: Fix the Obvious (Week 3-6)
Audit and improve product pages for top returned items
Add/improve size guides for apparel
Enable pre-shipment order modifications (self-service if possible)
Implement instant returns portal if you're still processing via email
Phase 3: Optimize the Flow (Week 7-12)
Set up exchange-first return flow
Add bonus credit incentive for exchanges over refunds
Implement return reason tagging with automation
Build return metrics dashboard
Phase 4: Continuous Improvement (Ongoing)
Weekly review of return metrics
Monthly product-level return analysis
Quarterly review of returns policy effectiveness
Ongoing A/B testing of prevention tactics
The Bottom Line
Returns are a cost of doing business in e-commerce. But they don't have to be an uncontrolled cost.
The merchants who win on profitability aren't the ones with the lowest return rates (though that helps). They're the ones who:
Understand the true cost beyond the refund amount
Prevent returns through better product information and pre-shipment flexibility
Convert returns to exchanges to retain revenue
Process efficiently to minimize operational drag
Measure and improve continuously
A 20% return rate isn't destiny. It's a starting point.
Every percentage point you shave off goes directly to margin. Every return you convert to an exchange keeps revenue in your ecosystem. Every order edit that prevents a return saves $20+ in processing costs.
The question isn't whether you can afford to invest in return reduction. It's whether you can afford not to.
Frequently Asked Questions
What's a "good" return rate for e-commerce?
It varies by category. Fashion: 20-30% is normal, under 20% is good. Electronics: 10-15% is normal. Home goods: 8-12% is typical. Compare yourself to category benchmarks, not overall e-commerce averages.
Should I offer free returns?
It depends on your margins and competitive landscape. Free returns increase conversion but also increase return rates. Many brands now offer free exchanges but charge for refund returns—a middle ground that encourages retention.
How do I handle serial returners?
First, identify them (return rate >50% over multiple orders). Then decide: are they unprofitable customers you should discourage, or high-volume customers whose lifetime value still justifies the returns? Some brands limit return privileges for serial returners; others accept it as cost of doing business.
What's the ROI of returns management software?
Typical returns platforms cost $100-500/month for mid-size stores. If they convert even 10% more returns to exchanges and save 2 hours/week of manual processing, they pay for themselves quickly. For Plus merchants, the ROI is usually obvious within 30 days.
How do pre-shipment order edits reduce returns?
When customers can fix mistakes (wrong size, wrong color, wrong address) before the item ships, you prevent returns at the source. A size swap before fulfillment costs nothing. A size swap after delivery costs $25+ in return processing.
What's the biggest mistake merchants make with returns?
Treating returns as purely a logistics/customer service problem rather than a product and information problem. The lowest-cost way to handle a return is to prevent it from happening.
Prevent returns before they happen. Revize Order Editing lets your customers edit their orders—change sizes, colors, quantities, and shipping details—before you ship. Shipping, taxes, and warehouse assignment recalculate automatically. Every edit is a return prevented. Try it free →
Related Resources


Revize your Shopify store. Lead with customer experience.

© Copyright 2026, All Rights Reserved
Revize your Shopify store. Lead with customer experience.
© Copyright 2026, All Rights Reserved
Revize your Shopify store. Lead with customer experience.
© Copyright 2026, All Rights Reserved
Revize your Shopify store. Lead with customer experience.
© Copyright 2026, All Rights Reserved